Currents (2020)- solo events excepts

Currents is a six-movement octet (fl, ob, cl, a.sax, tpt, hn, tbn, perc) that musically depicts the NOAA’s database of the last forty years of billion dollar weather disasters in the United States. The data is translated into music through sonification, which can be described as “the process of mapping data with some other meaning into sound” (John Luther Adams, The Place Where You Go To Listen: In Search of an Ecology of Music). Each instrument in the octet is tied to a specific kind of weather event to depict throughout the piece. This is featured most prominently in a solo moment for each instrument, which are interspersed throughout several of the movements of the piece, that views one particular weather event in detail. A collection of these solo works are presented here as a standalone piece from the larger work Currents.
Collectively, the 285 weather events depicted in the entirety of Currents have cost $1.875 trillion and have taken 14,485 lives. From 2010-2019 alone, there were 119 events that cost $802 billion and claimed 5,217 lives. 2020 had a record-breaking 22 events, the most out of any year to date. Currents is a way of giving this data a more visceral narrative, keeping the conversation afloat about the urgency of climate change and the ominous shift in weather patterns on our planet.
Quick overview of the sonification process:
Oboe: 1980 Heat Wave, pitch of the oboe is sonified using a weather temperature map on the day of the heat wave
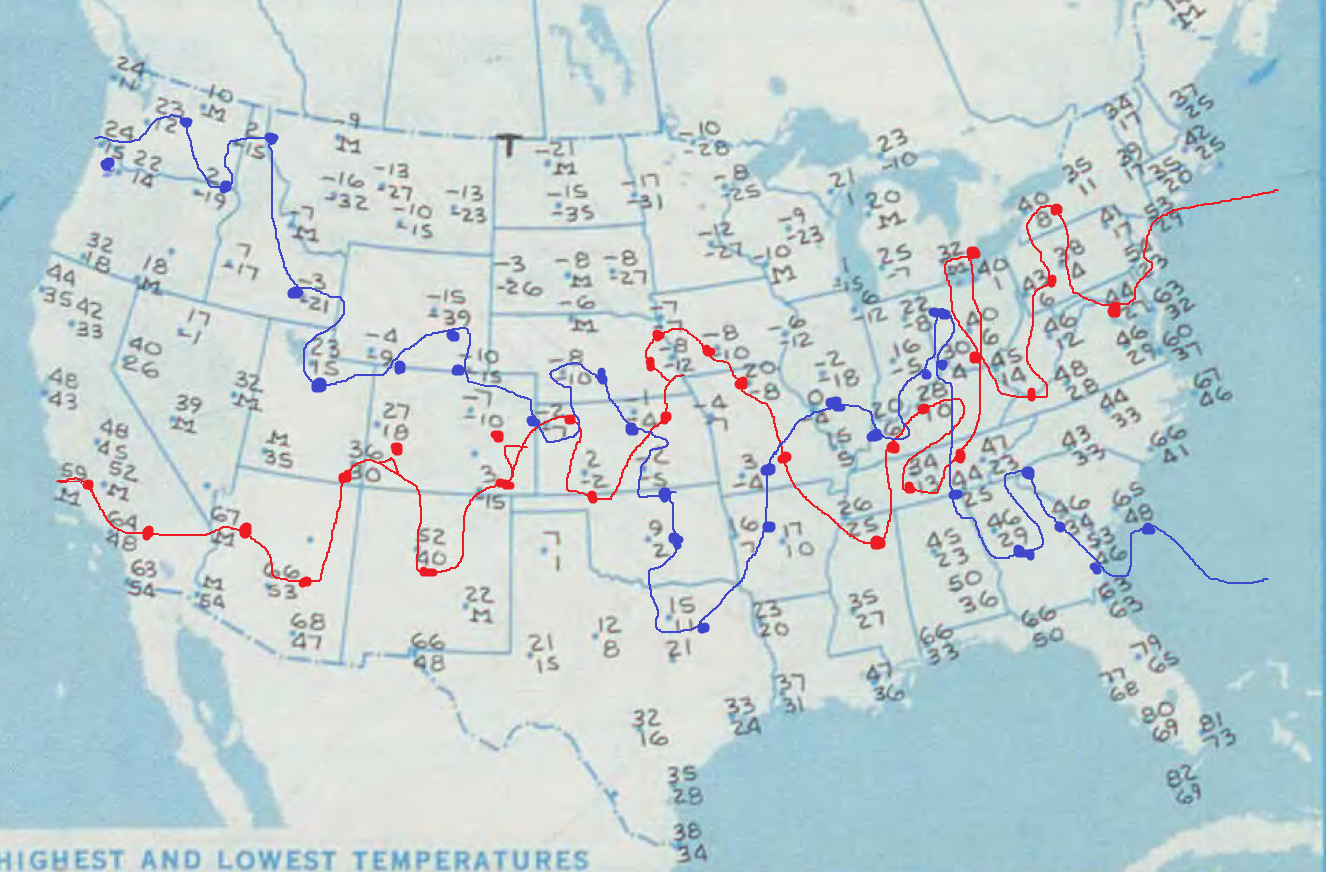
Clarinet: 1983 Freeze, pitch of the clarinet is sonified using a weather temperature map on the day of the freeze event
Horn: 1993 Storm of the Century, the tessitura of the horn is sonified using a table detailing the snow fall in inches
Trumpet: 1998 Eightieth Anniversary of Migratory Bird Treaty Act, intermixes recordings of bird calls with the trumpet calls to depict the effect of our shifting climate on the bird population
Saxophone (not featured in the video): 2005 Hurricane Katrina, the distortion of the saxophone’s sound is sonified using the Saffir-Simpson hurricane scale, also uses a vocal sample from Spike Lee’s “When the Levees Broke”
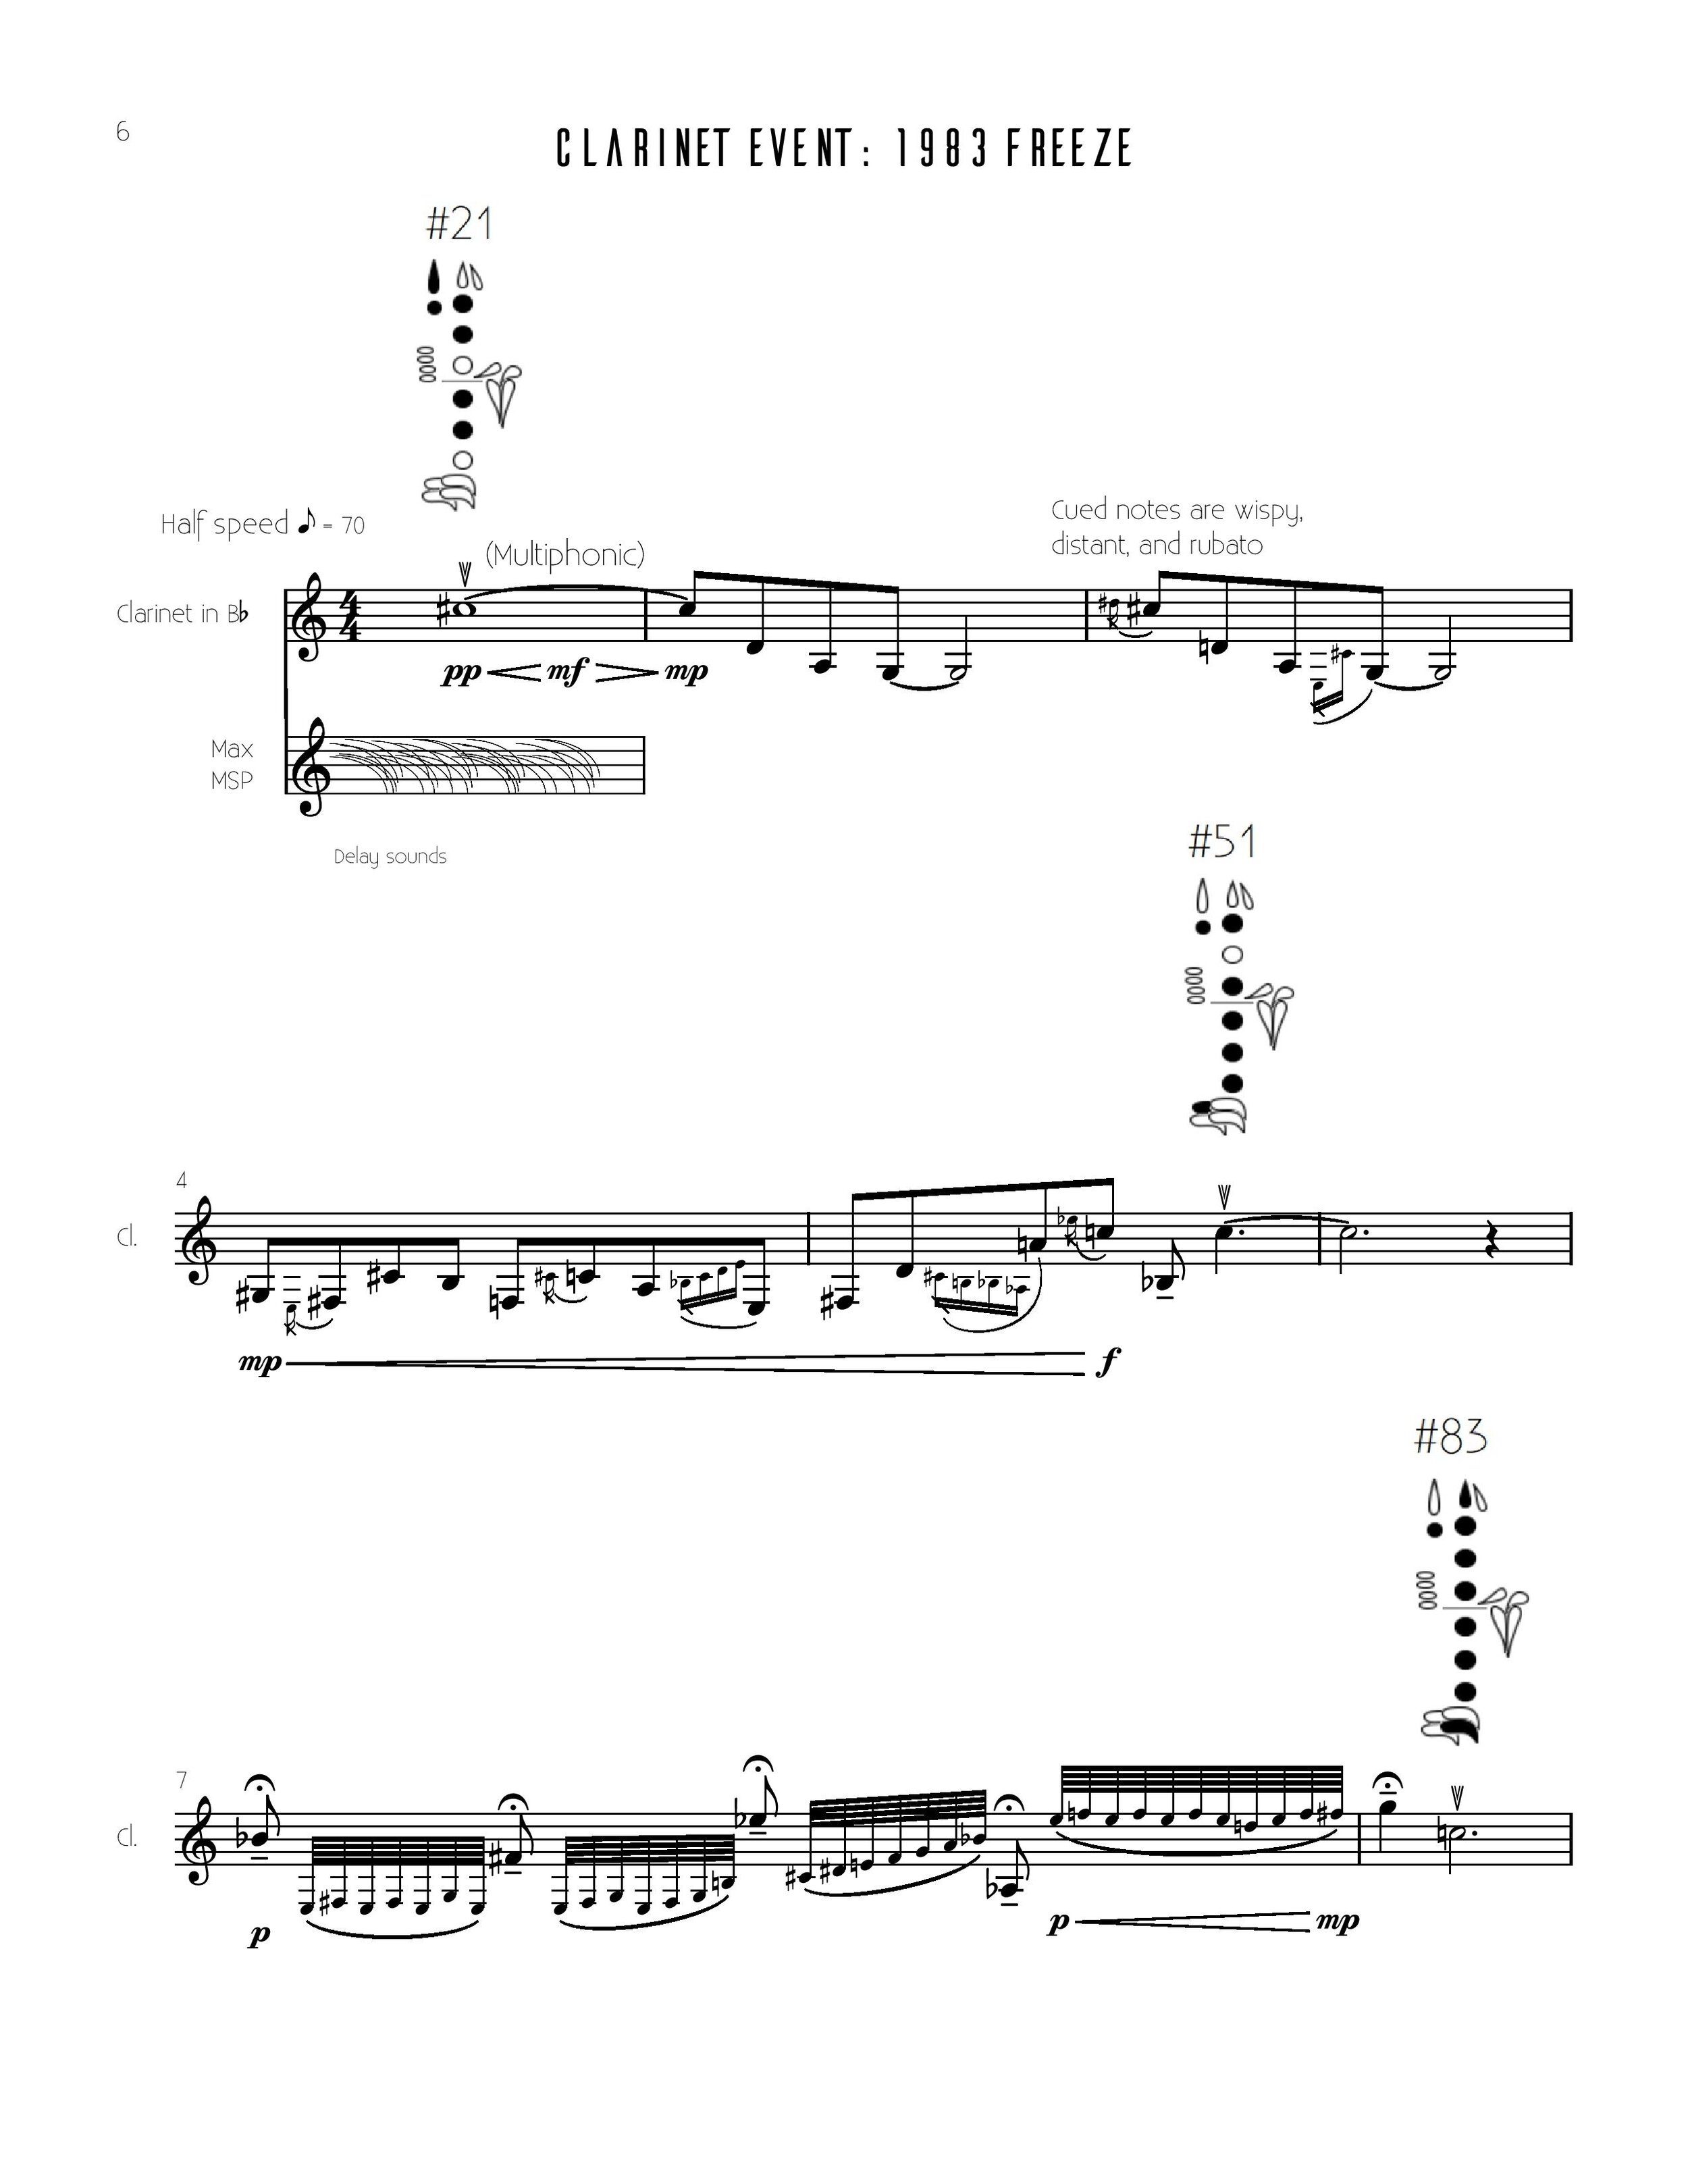
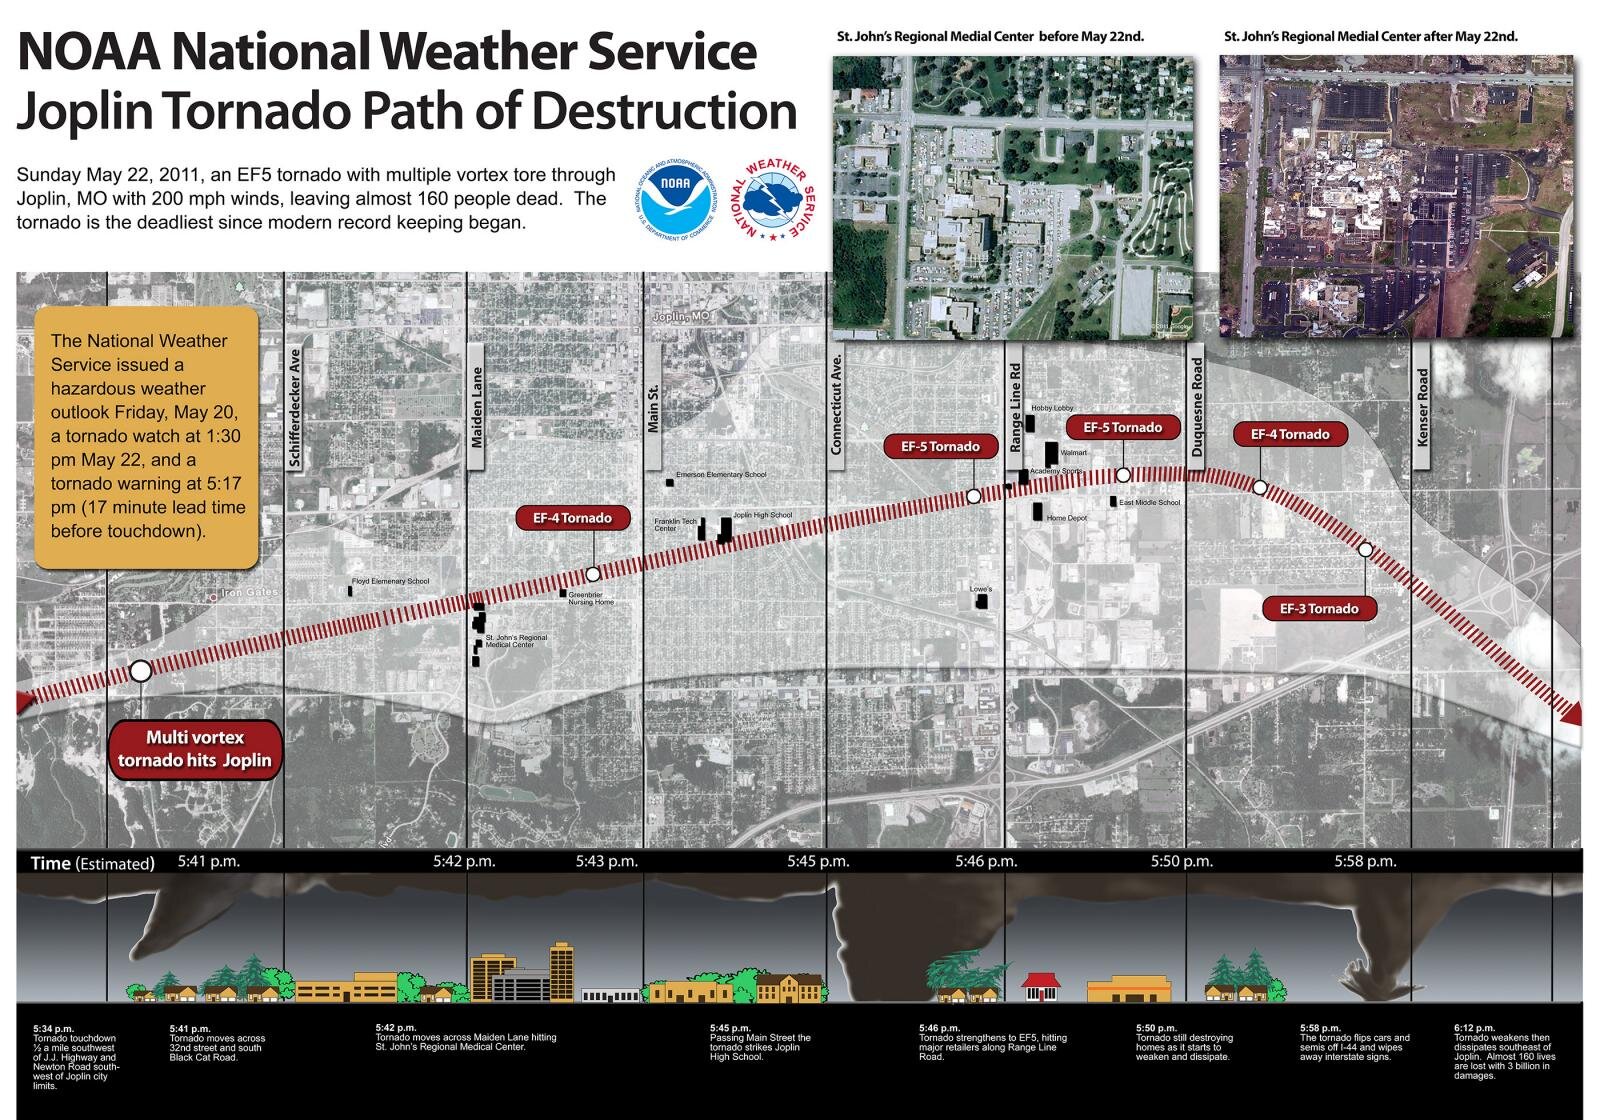
Flute: 2011 Joplin Tornado, the pitch and dynamics of the flute are sonified using wind speeds and the Fujita tornado scale
Percussion: 2014 Detroit Flood, the number of percussion instruments used is sonified by the amount of rainfall over time
Trombone: 2018 Campfire, the pitch of the trombone is sonified using latitude/longitude coordinates of the movement of the fire
Four in-depth examples of the sonification process:
The heat wave in the summer of 1980 not only created a swath of agricultural damage (totaling $33.2 billion, CPI adjusted), but also caused rash of heat-related deaths (1260 direct deaths/10,000 indirect deaths), a sobering reminder of the fact that heat waves are second only to hurricanes as the leading weather related killer in the United States. The pitches of the oboe’s melody were created from translating temperature map data into MIDI note numbers. Max/MSP provides searing pitch-shifting effects and a shimmering, mirage-like phasor to the oboe’s soaring, biting tessitura.

The red line I drew in the temperature map above was used to create the pitches of the oboe’s melody.
The Christmas morning air of 1983 brought 22°F temperatures to Florida, destroying 120,000 acres of citrus trees and creating $5 billion in damages. A mirror image to the oboe solo, the pitches for the clarinet were created from sonifying a 1983 temperature map in the inverse direction that was used to create the oboe solo. The multiphonics, as well as the Max/MSP treatments (it highlights specific notes of the clarinet using reson~ filters and treats them with delay effects) creates an eerie, crystalline sheen.

The blue line I drew in the temperature map above was used to create the pitches of the clarinet’s melody. Notice the inverse relationship between the red line (oboe melody, heat) and the blue line (clarinet melody, freeze).
Out of the 180 tornadoes that touched down on May 2011, the EF-5 tornado that demolished Joplin, MO was by far the most notable. It caused 160 deaths, making it the single deadliest U.S. tornado since modern record keeping began in 1950. The whirling pitches for the flute are sonified from the wind speed measurements of the tornado (based on the Enhanced Fujita scale) and follow the gradual build up and disillusion of the storm. Max/MSP uses a vocoder to merge the flute sound with a sawtooth wave, giving the vague impression of a tornado warning siren.
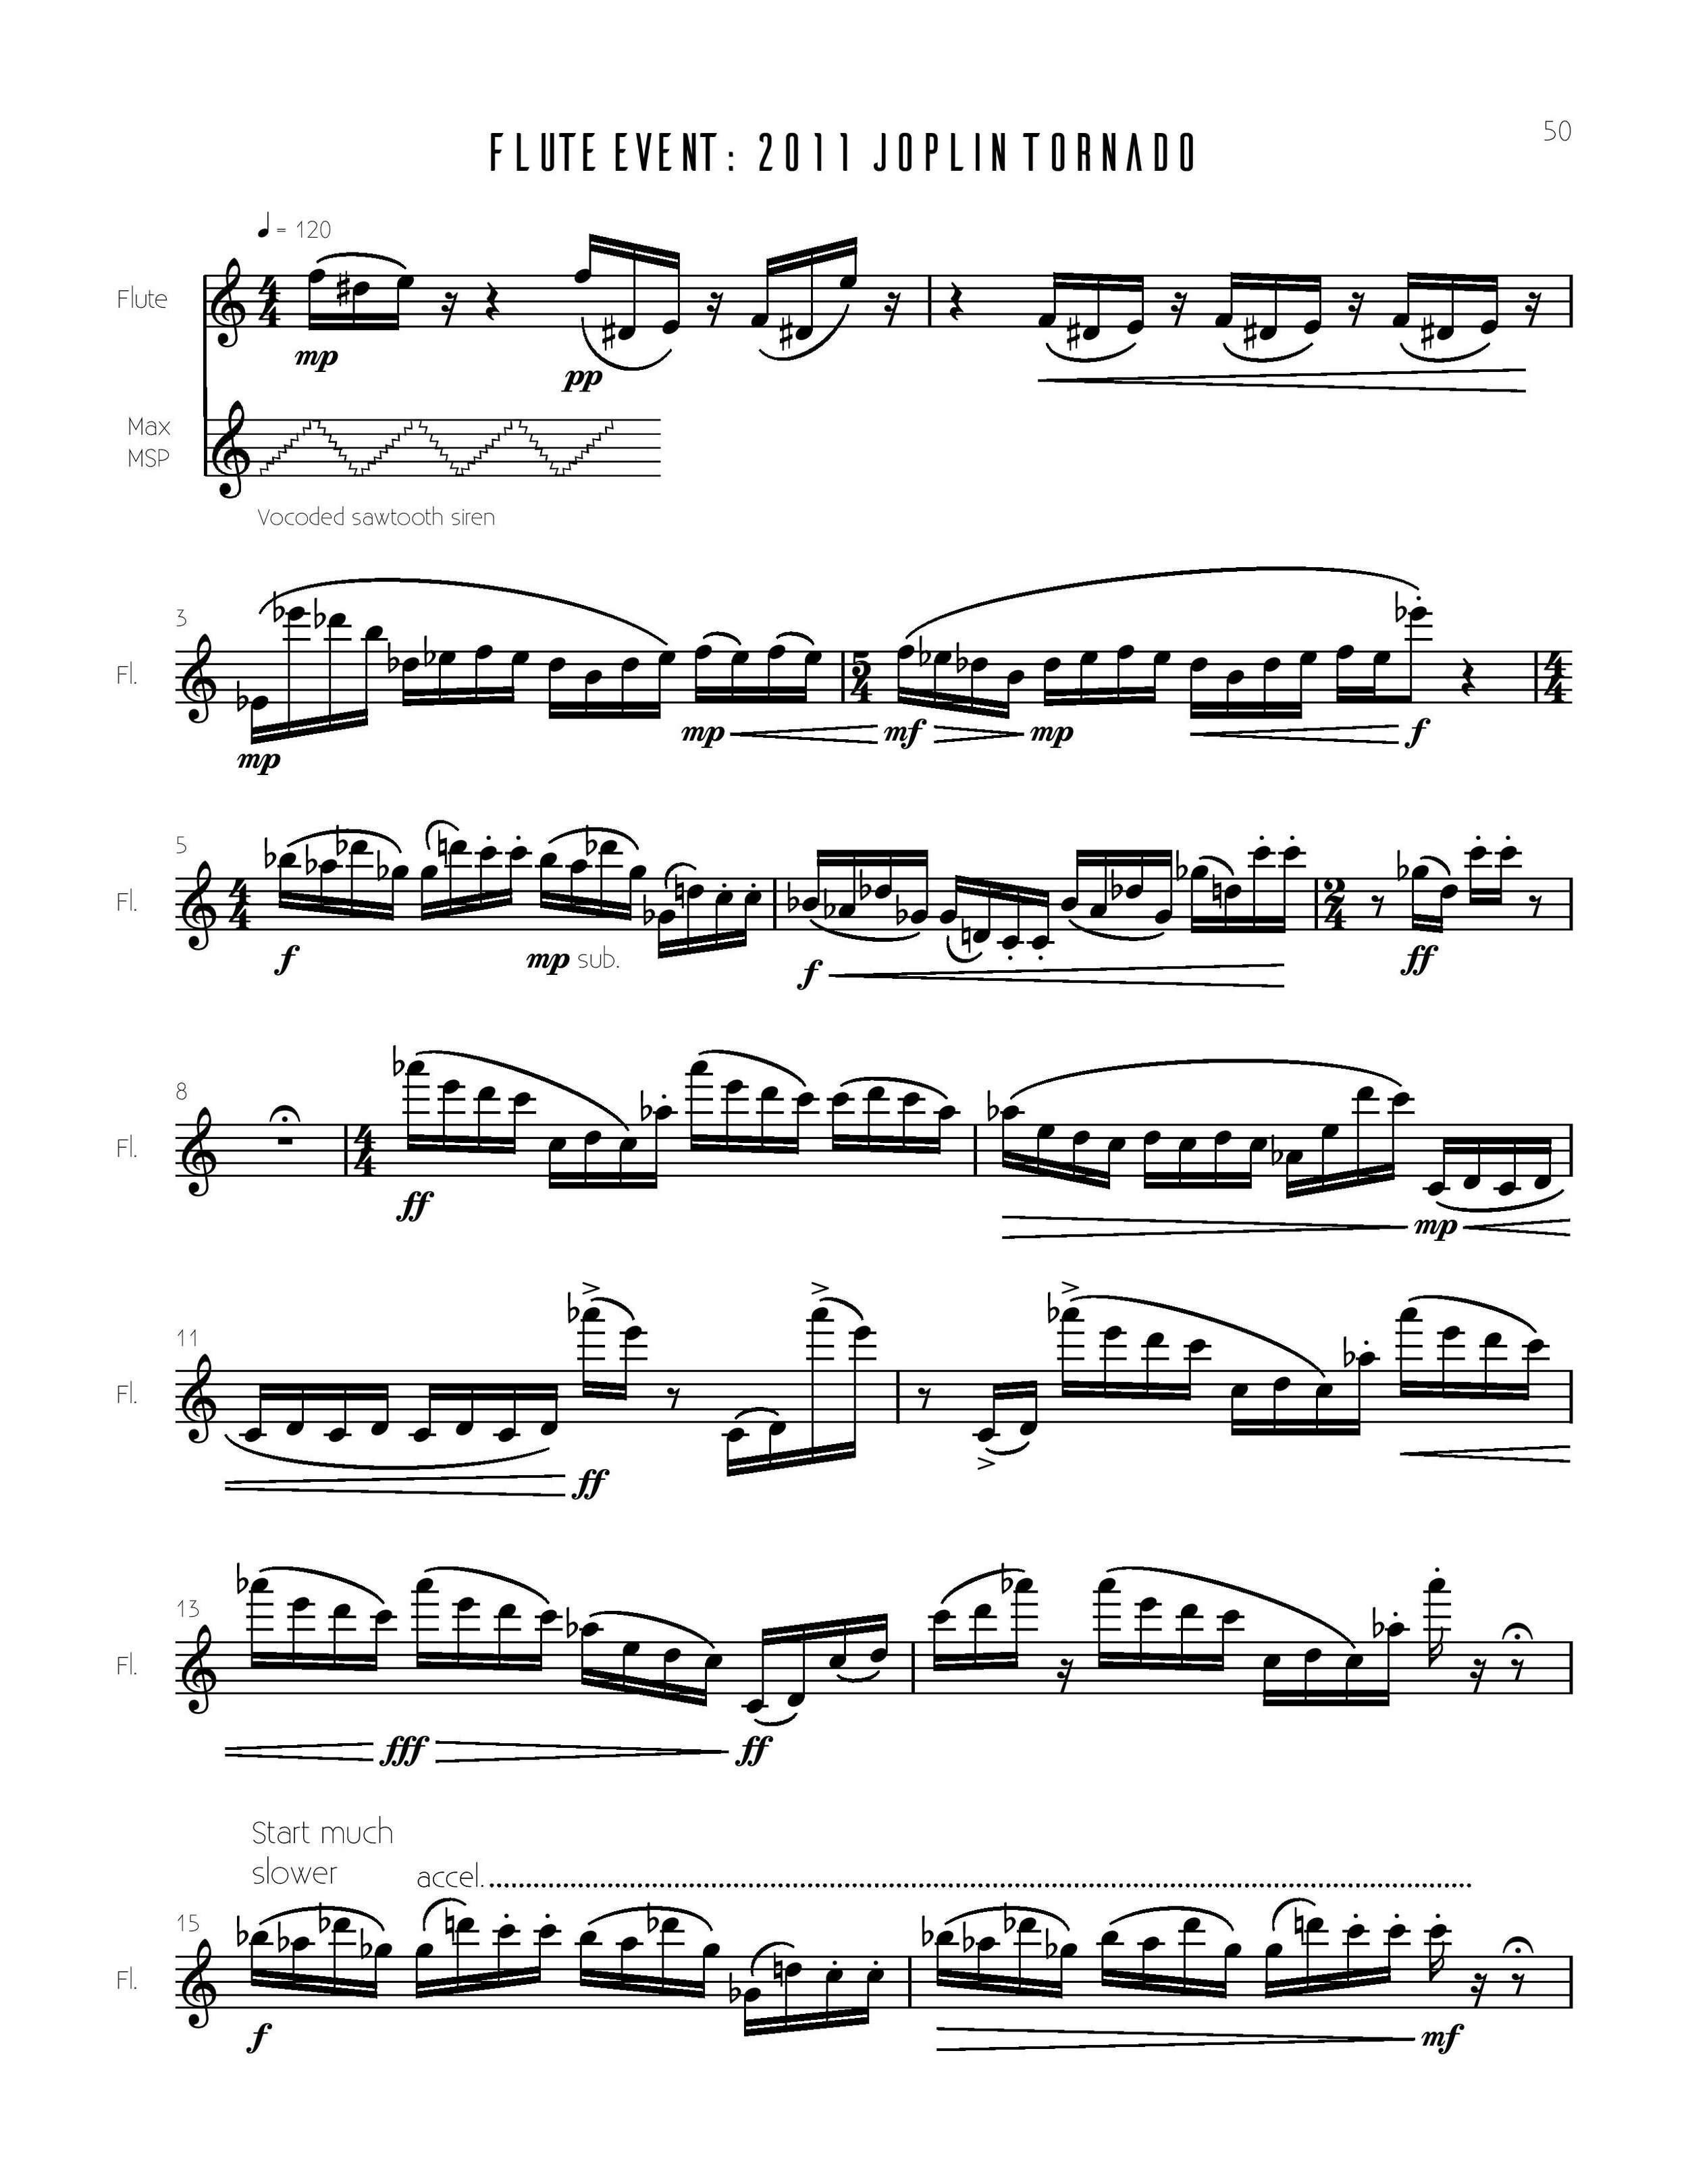
Here is one of the data resources uses to create the pitch and dynamic information for the flute.
The Camp Fire wildfire that struck Paradise, CA in 2018 was both the costliest (18,500 buildings destroyed) and deadliest (88 deaths) wildfire in U.S. history. Just as any wildfire begins with a single spark, Max/MSP grabs the opening trombone motive and gradually creates 88 copies of it, transforming it into a roaring wall of sound. Meanwhile, the trombone melody travels across the map of Paradise as the latitude/longitude of the fire’s movements are sonified into notated pitches. At the end of the piece, the trombone glissandos morph into a warning siren as the electronics swirl into an unstoppable force around the player.
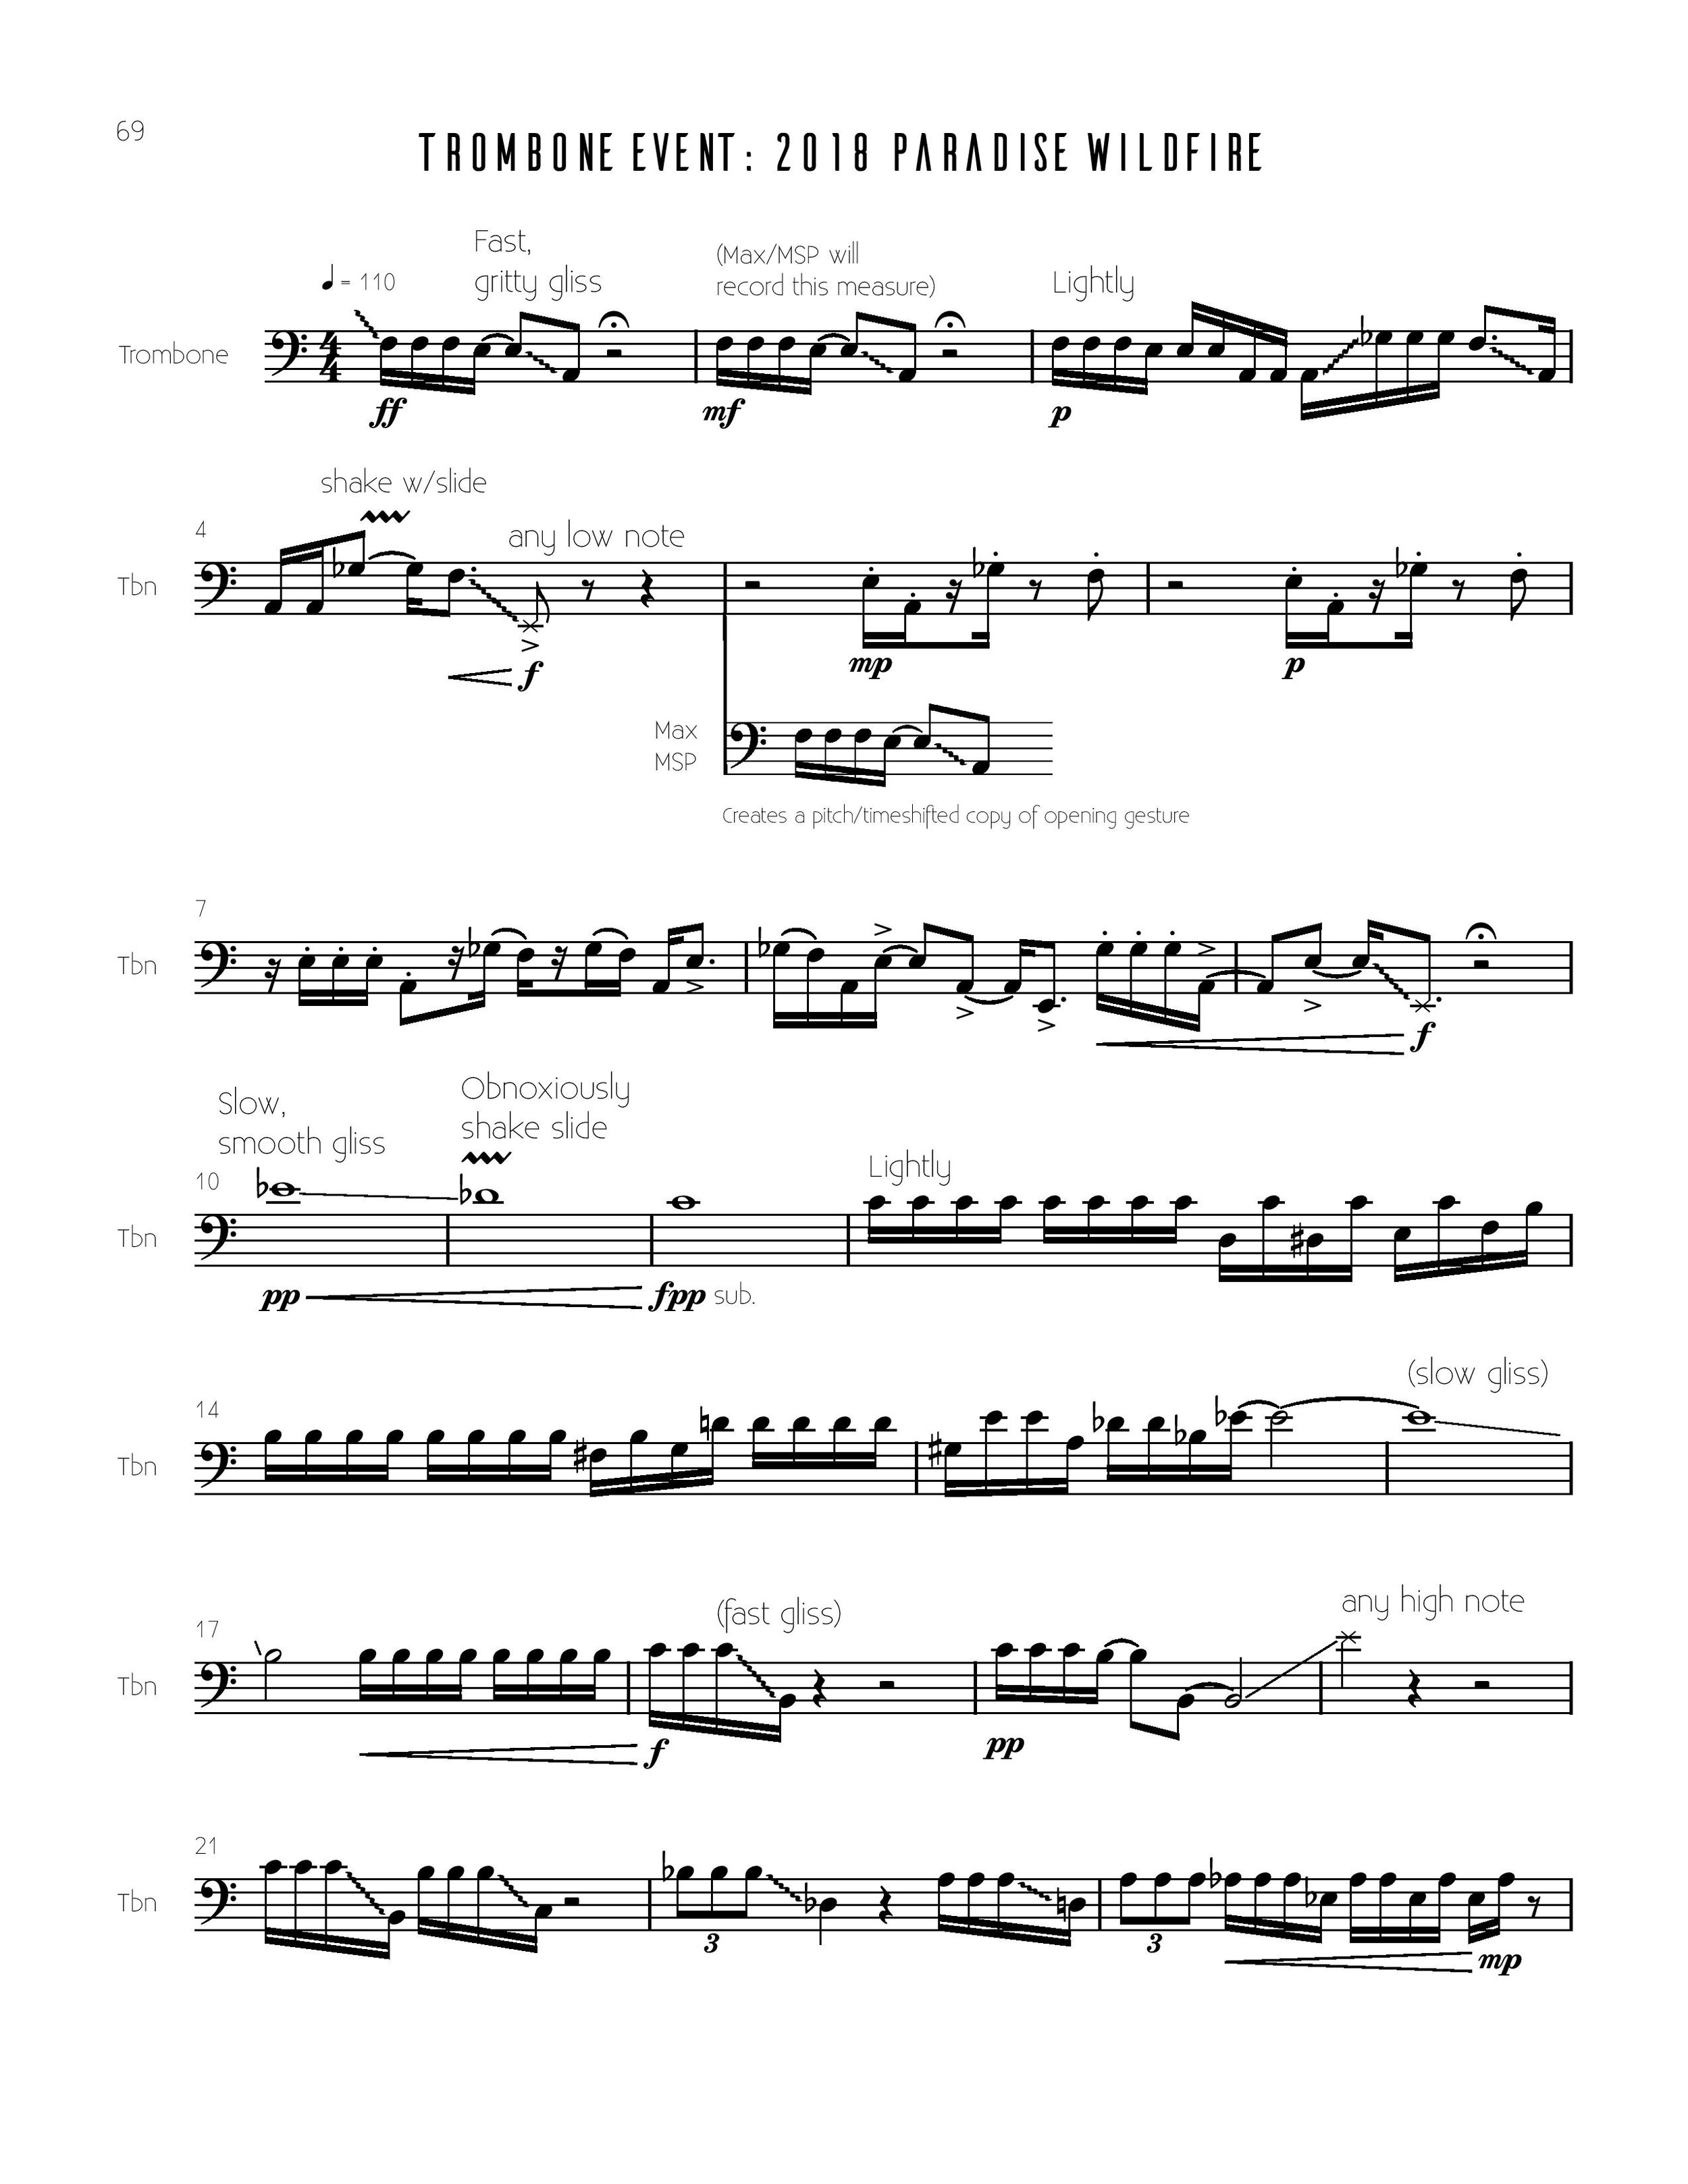
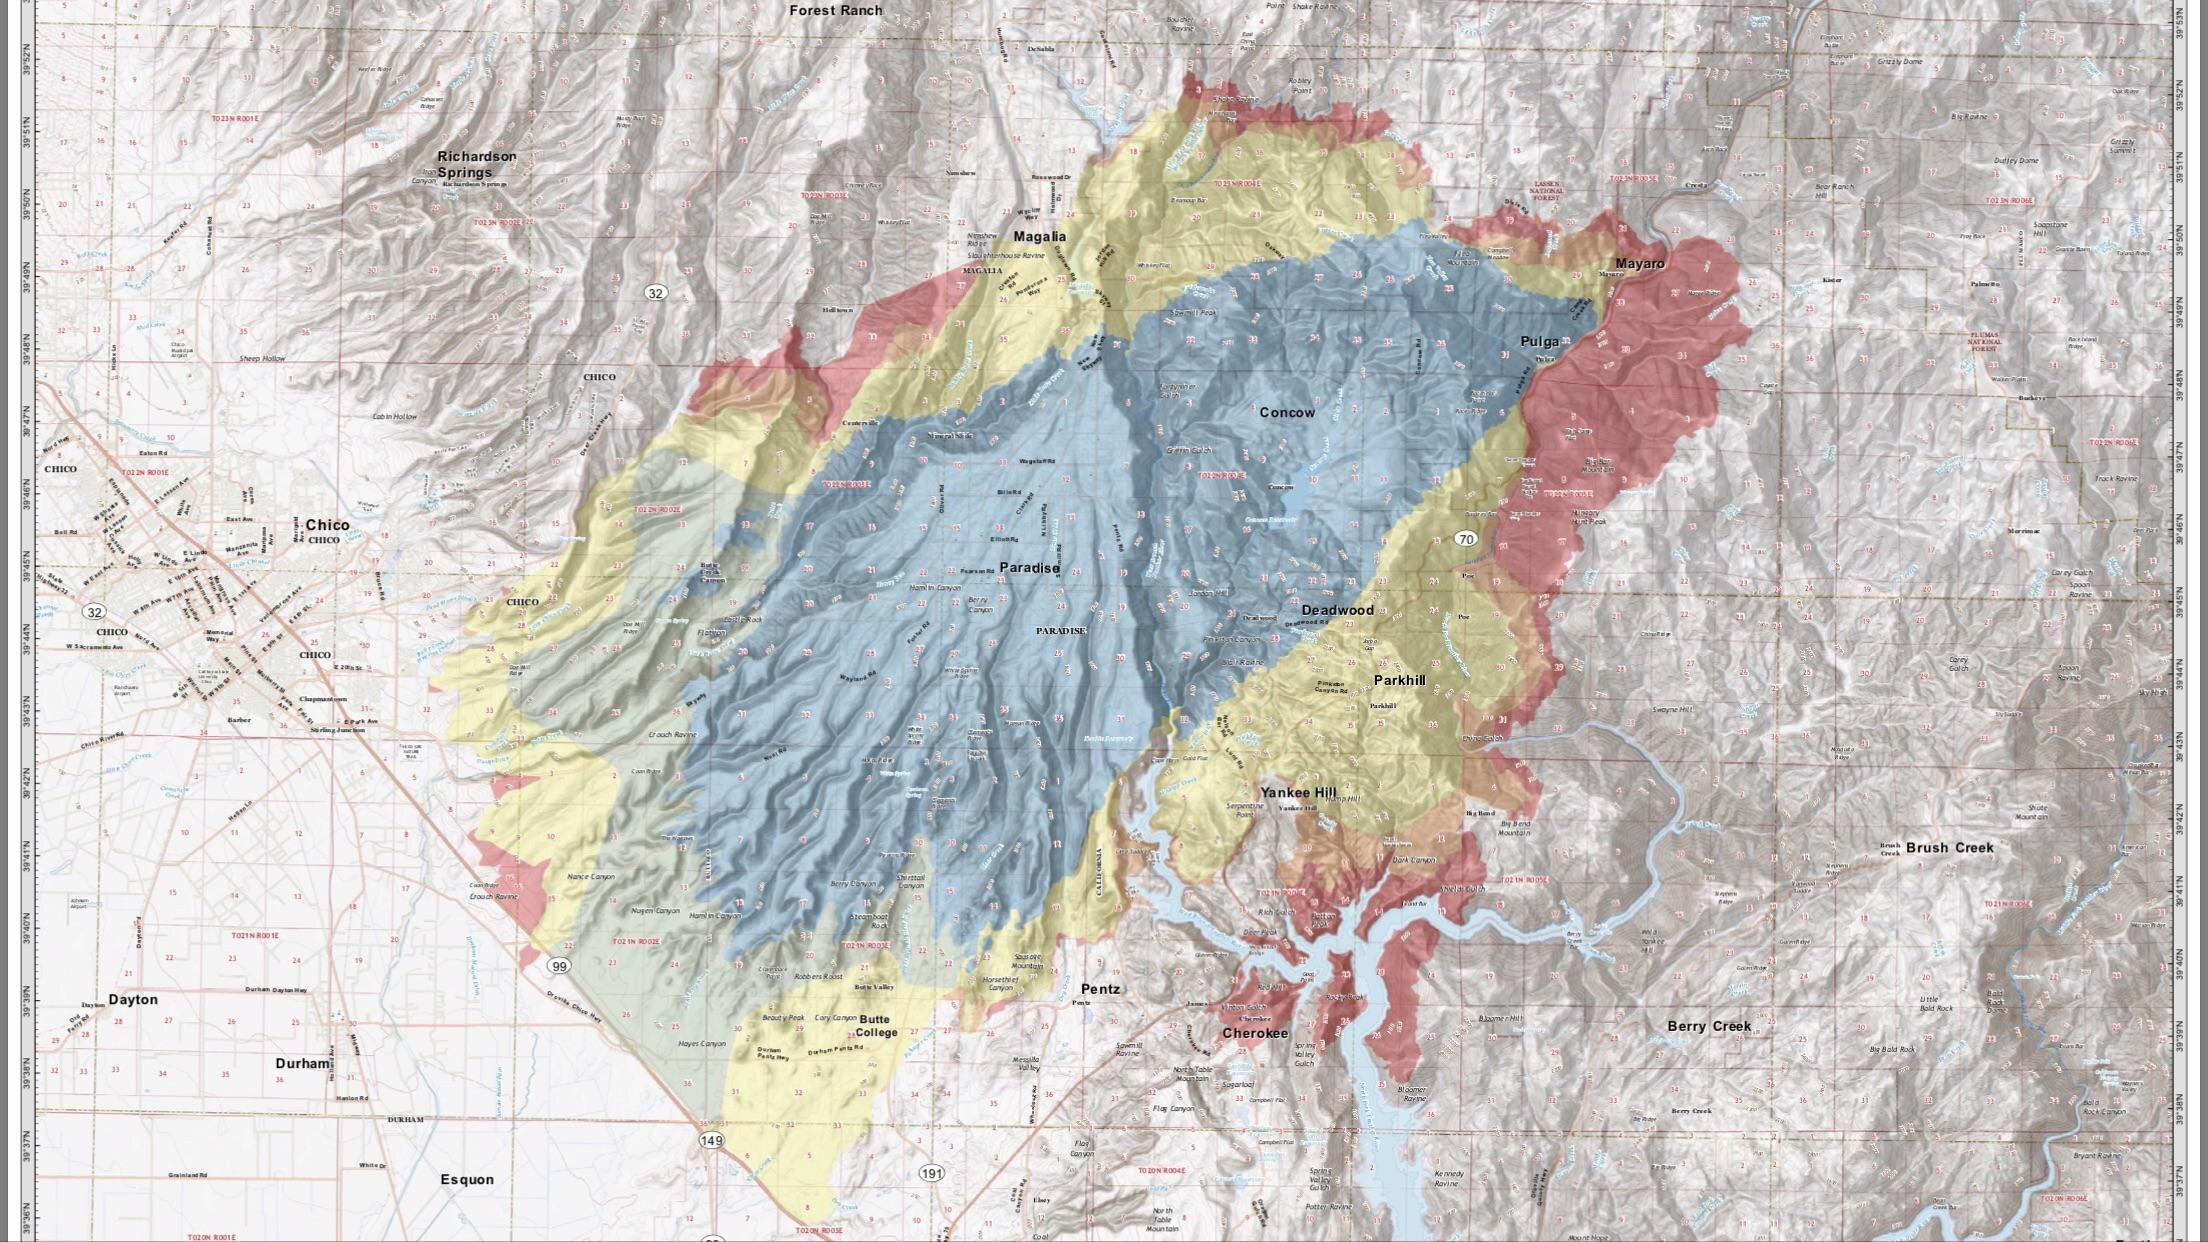
The latitude/longitude data of the fire’s progression were used to create pitch information for the trombone’s melody.